5.1 - Creating or Editing Audit Reports
Audit reports combine selected sensor records, alert information, annotations, statistics, charts, and compliance details into a configurable PDF report.
Users with the Audit Admin role can create and edit audit reports and configure automatic email schedules. Completed reports are made available to authorised users through Audit Reports in the Visualisation section of the platform sidebar.
Open Audit Maintenance in the administration area and select Add / Edit Audit Reports. The index page lists the audit reports created under the company account, with Edit and Delete actions available for each report.
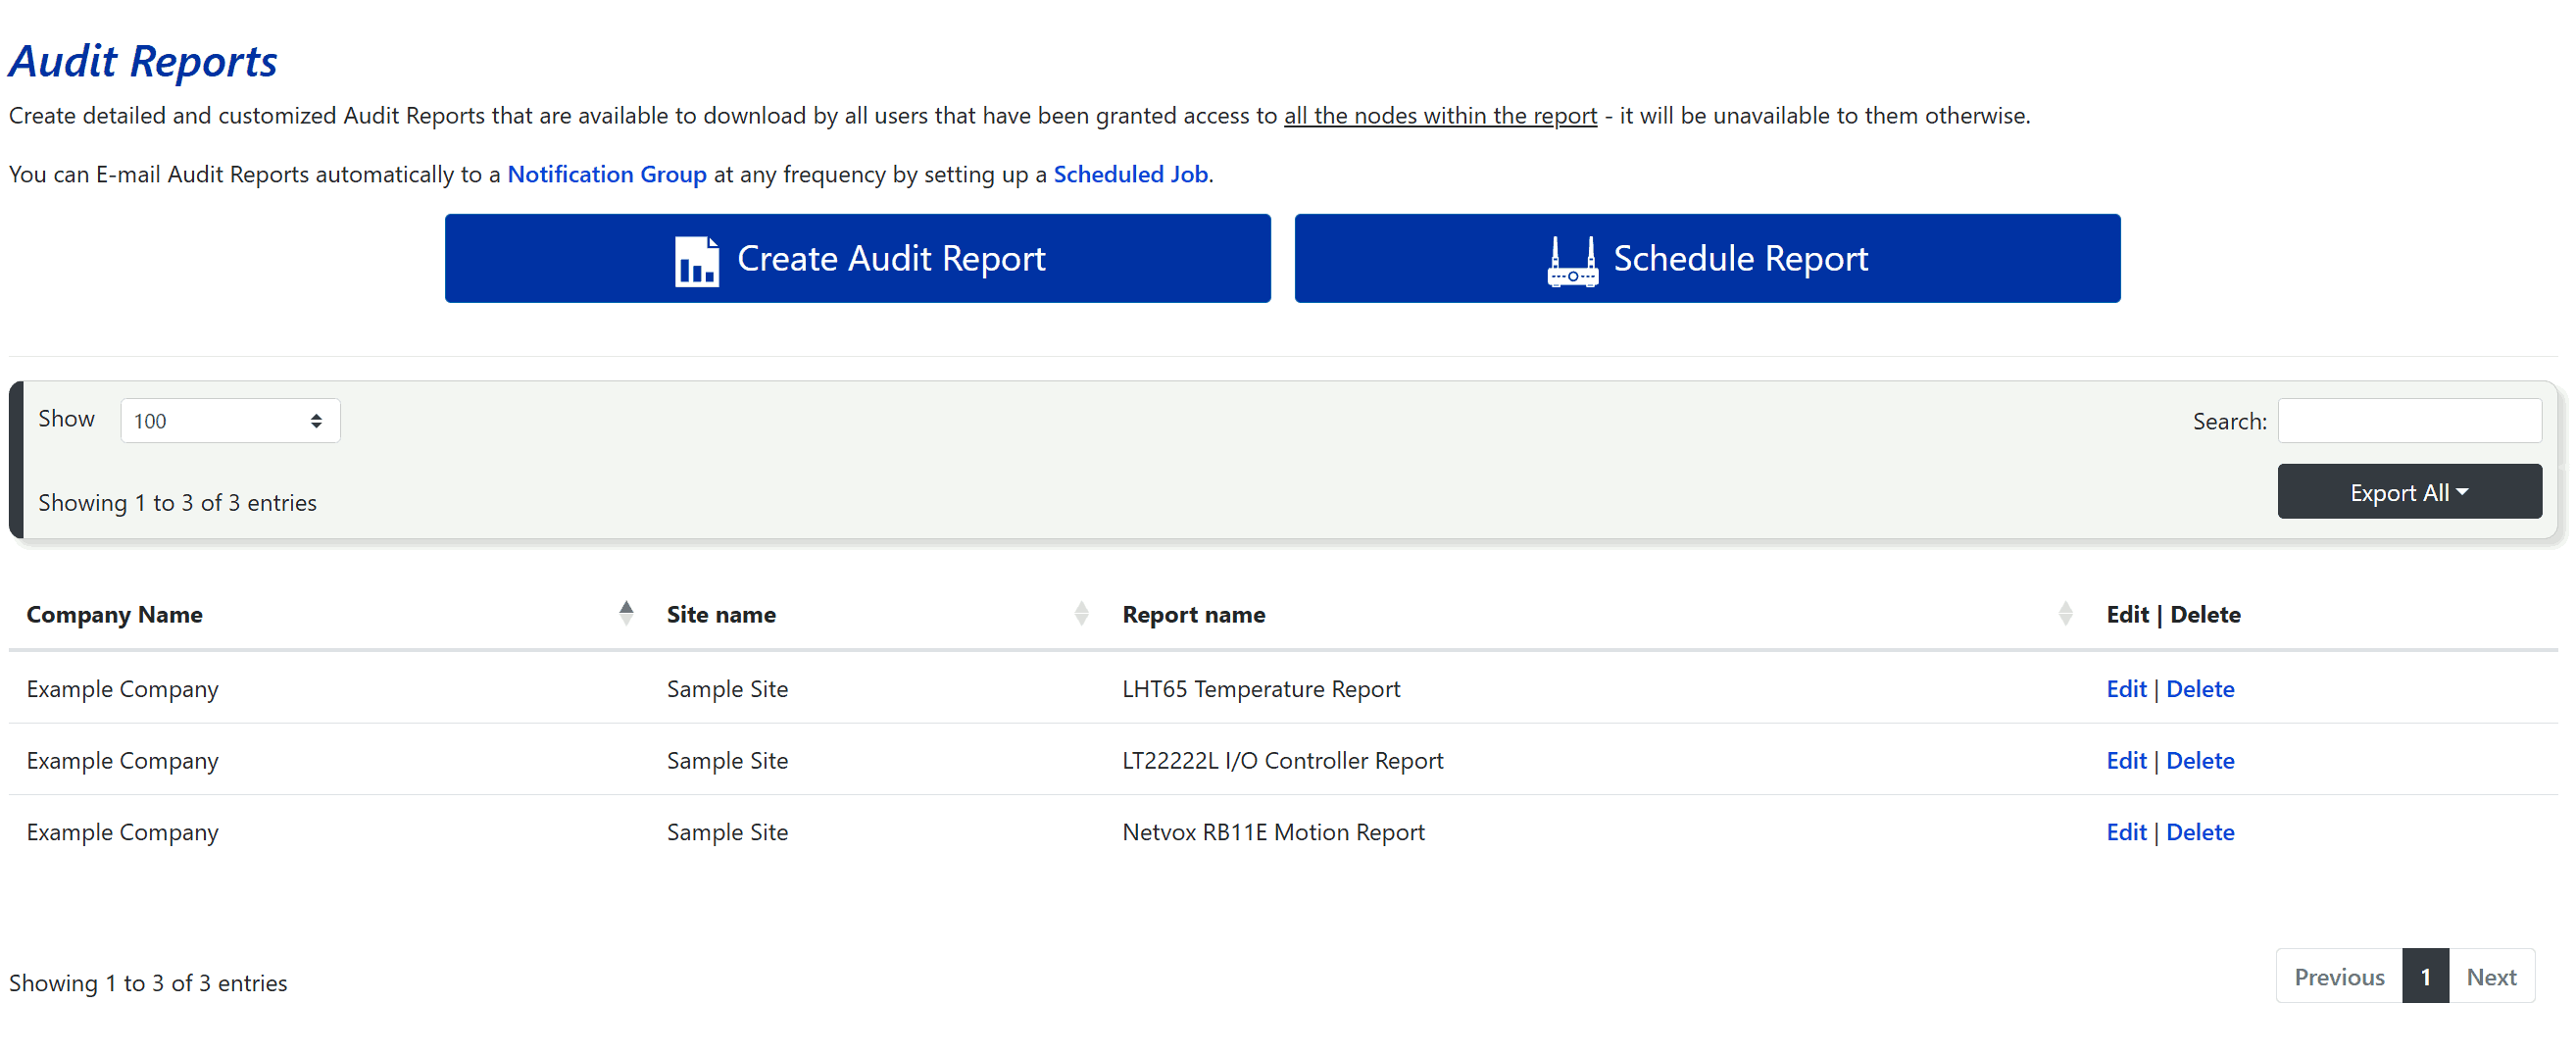
Configure the Audit Report
Select Create Audit Report at the top of the index page, or select Edit beside an existing report. The same form is used for both actions and is organised into three main areas.
Enter the Report Details
Enter a unique Site Name and Report Name, then select the Time Zone used for dates and times in the report. The report time zone can differ from the host account time zone.
Choose the Information to Include
Select the charts, alert records, annotations, statistics, detailed data, raw-data extracts, audit events, and signature content required for the report. Each option is explained below.
Add Nodes and Sensor Inputs
Use Add Node to include each required node, select the sensor input, enter optional chart limits, and set the order in which the records appear.

Information to Include
Alert Configuration and Notifications
- Include Alert Setup: Lists the alerts configured for each included node.
- Include Email Alerts: Lists email notifications sent during the report period, including the time and recipient.
- Include SMS Alerts: Lists SMS notifications sent during the report period, including the time and recipient.
Charts and Device Statistics
- Include Charts: Adds a chart for each included sensor input, with the configured upper and lower limits.
- Include Device Statistics: Adds minimum, maximum, average, and standard-deviation values for the selected period.
Annotations and Audit Events
- Include Annotations: Lists annotations recorded against alert and recovery events. See Section 4.3 - Adding and Editing Annotations .
- Include Audit Events: Adds detailed audit-event information for compliance records. This can produce a large amount of data, so a separate audit report may be preferable.
Detailed Data in the PDF
Include Detailed Data adds the raw data for all selected nodes as a table at the end of the PDF. This can significantly increase the report size and is generally best used only when the detailed records are required.
CSV and Excel Extracts
- Include CSV Extract: Attaches a CSV file containing the recorded data when the report is sent by a scheduled job.
- Include Excel Extract: Attaches an Excel workbook containing the recorded data when the report is sent by a scheduled job.
These options apply only to scheduled reports. CSV and Excel files can also be downloaded manually from the Audit Reports page by selecting the required Output Format. See Section 5.2 - Downloading Audit Reports.
Excel Sheet Protection
Protect Excel Sheet applies protection to generated Excel workbooks to restrict normal editing and worksheet structure changes.
This protection is separate from document verification. If the workbook will be modified using the Telemetry2U Excel macros, this option must be disabled because the macros need to create or replace worksheets.
Document Verification
Include Document Verification adds a unique Document ID and verification link to generated PDF, CSV and Excel files.
Telemetry2U stores the original SHA-512 hash for the generated file. The Document Verification page can then calculate the hash of an uploaded file and compare it with the stored value to confirm whether the file is identical to the original generated document.
Editing, re-saving, digitally signing or otherwise modifying a file can change its hash. Keep the original downloaded file unchanged when document verification is required.
Digital Signature Page
Include Signature Page adds digital-signature fields at the end of the PDF. See Section 5.4 - Digitally Signing an Audit Report for the signing process.
Audit events and electronic signatures can support records managed under FDA 21 CFR Part 11.
Nodes to Include
Select a node from Add Node, then configure each row. The same node can be added more than once when several sensor inputs from that node are required.
- Input: Selects the sensor input included in the report.
- Lower Limit: Adds a blue lower-limit line to the sensor chart.
- Upper Limit: Adds a red upper-limit line to the sensor chart.
- Sort Order: Controls the order in which nodes and sensor inputs appear.
- Delete: Removes the selected sensor input from the report configuration.
5.2 - Downloading Audit Reports
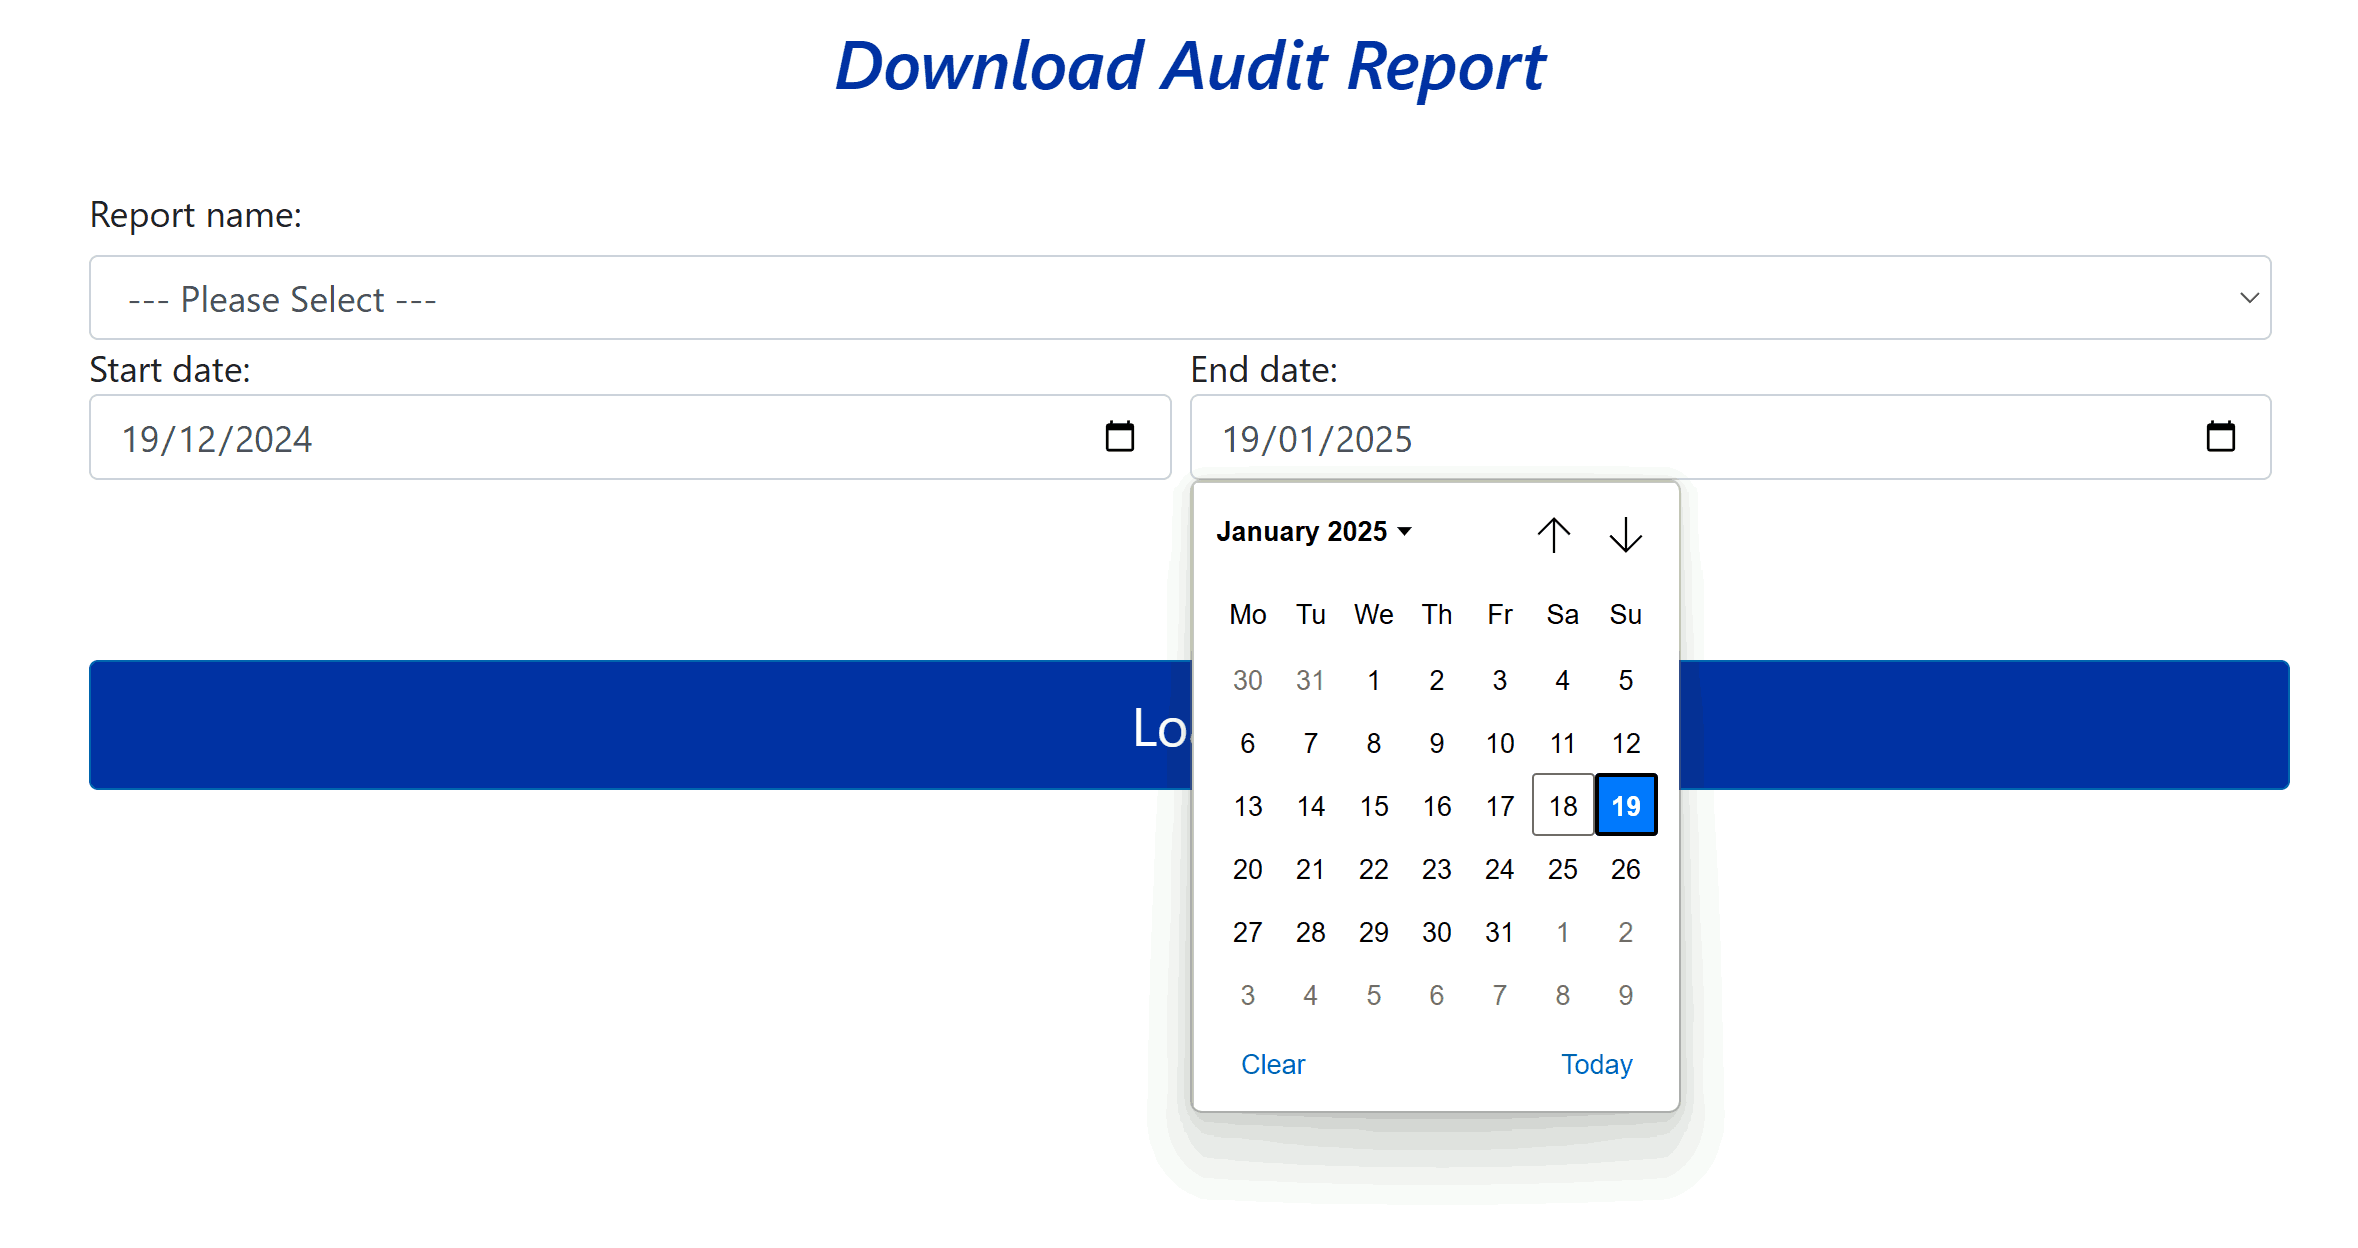
The Audit Reports page is available to users through the Visualisation section of the platform sidebar.
A report is visible only when the user has access to every node included in that report. Node access is managed through Section 6.2.3 - User Roles and Node Access Control . Users without the Audit Admin role can download available reports but cannot change their configurations.
- Select the required report from Report Name.
- Enter the required Start Date and End Date.
- Select the required Output Format: PDF, Excel or CSV.
- Select Load.
PDF generates the formatted audit report. Excel and CSV provide the recorded data in formats suitable for further review or analysis. Excel exports contain a separate worksheet for each selected sensor input.
5.3 - Automatically Emailing Audit Reports
Users with the Audit Admin role can create scheduled jobs that generate and email audit reports automatically.
Create the Audit Report
Confirm that each report to be emailed has already been configured. See Section 5.1 - Creating or Editing Audit Reports.
Prepare an Email Notification Group
Create a notification group containing at least one user who can receive email. See Section 6.2.4 - Notification Groups . A dedicated group can keep audit-report recipients separate from operational alerts.
Create the Schedule
Open Audit Maintenance in the administration area and select Create Audit Report Schedule. Complete the following fields:
- Description / Email Subject: Enter the subject line used for the email.
- Email Notification Group: Select the group containing the report recipients.
- Item to Run: Select the audit report to generate.
- Run Frequency: Choose how often the job runs, such as daily, weekly, or monthly.
- Run On: Select the applicable day for the schedule.
- Run At Time: Set the time at which the report is generated and sent.
Select Enabled to activate the schedule, then select Create to save it.
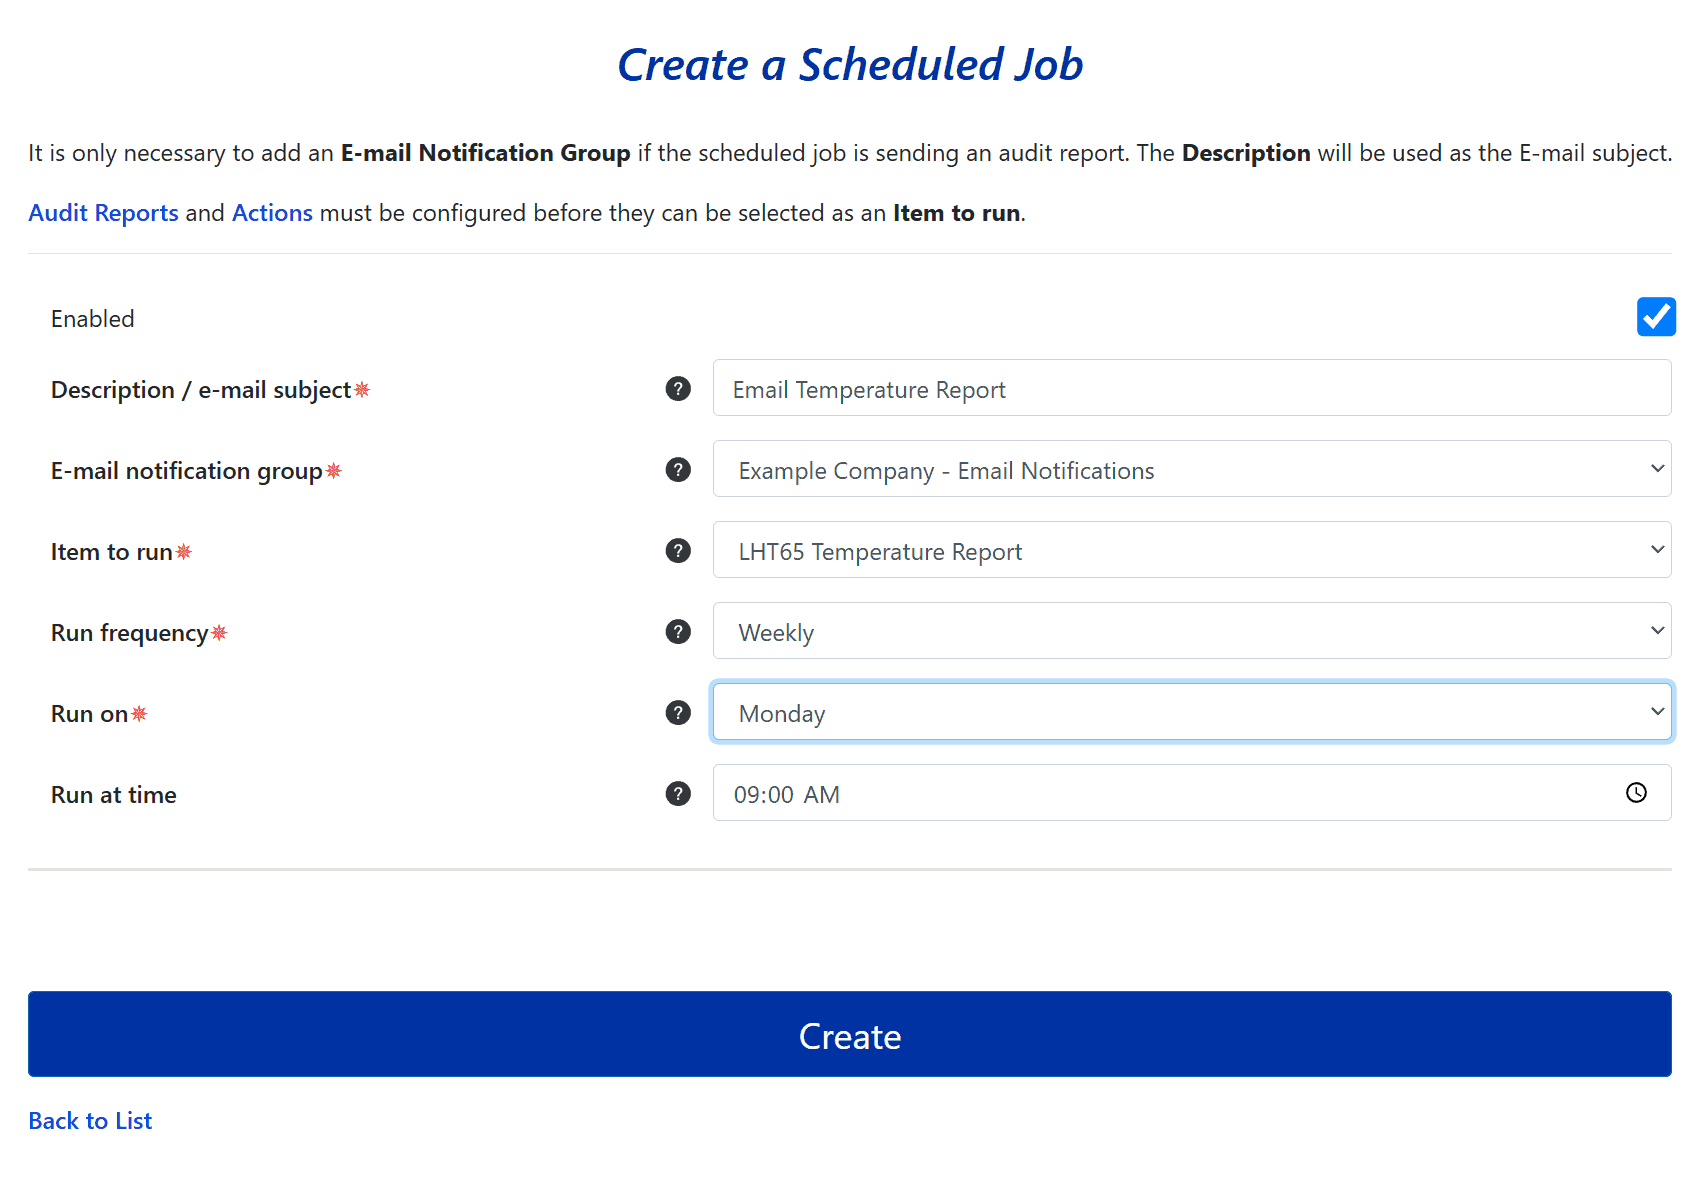
5.4 - Digitally Signing an Audit Report
When an audit report includes a signature page, the downloaded PDF can be signed electronically without printing, signing, and scanning the document.
A digital signature securely associates a signer with a document and records the signing transaction. Public Key Infrastructure, or PKI, is the commonly accepted standard used for this type of electronic signature.
The signature page contains two fields:
Checked by
The person responsible for reviewing and validating the audit report.
Approved by
The person responsible for approving or verifying the completed report.
Apply the Digital Signature
- Download the audit report as described in Section 5.2 - Downloading Audit Reports.
- Save the PDF locally and open it in a desktop PDF application that supports digital signatures, such as Adobe Acrobat Reader. Most web-browser PDF viewers cannot apply a certificate-based signature.
- Select the appropriate signature field in the PDF.
- Choose an existing digital ID or create a new one when prompted.
- Apply and save the signature. A digitally signed document cannot then be modified without invalidating the signature.
Adobe Acrobat Reader can also request a signature from another person. For more information about digital IDs, refer to Adobe's digital ID guidance.
5.5 - Adding and Managing Annotations
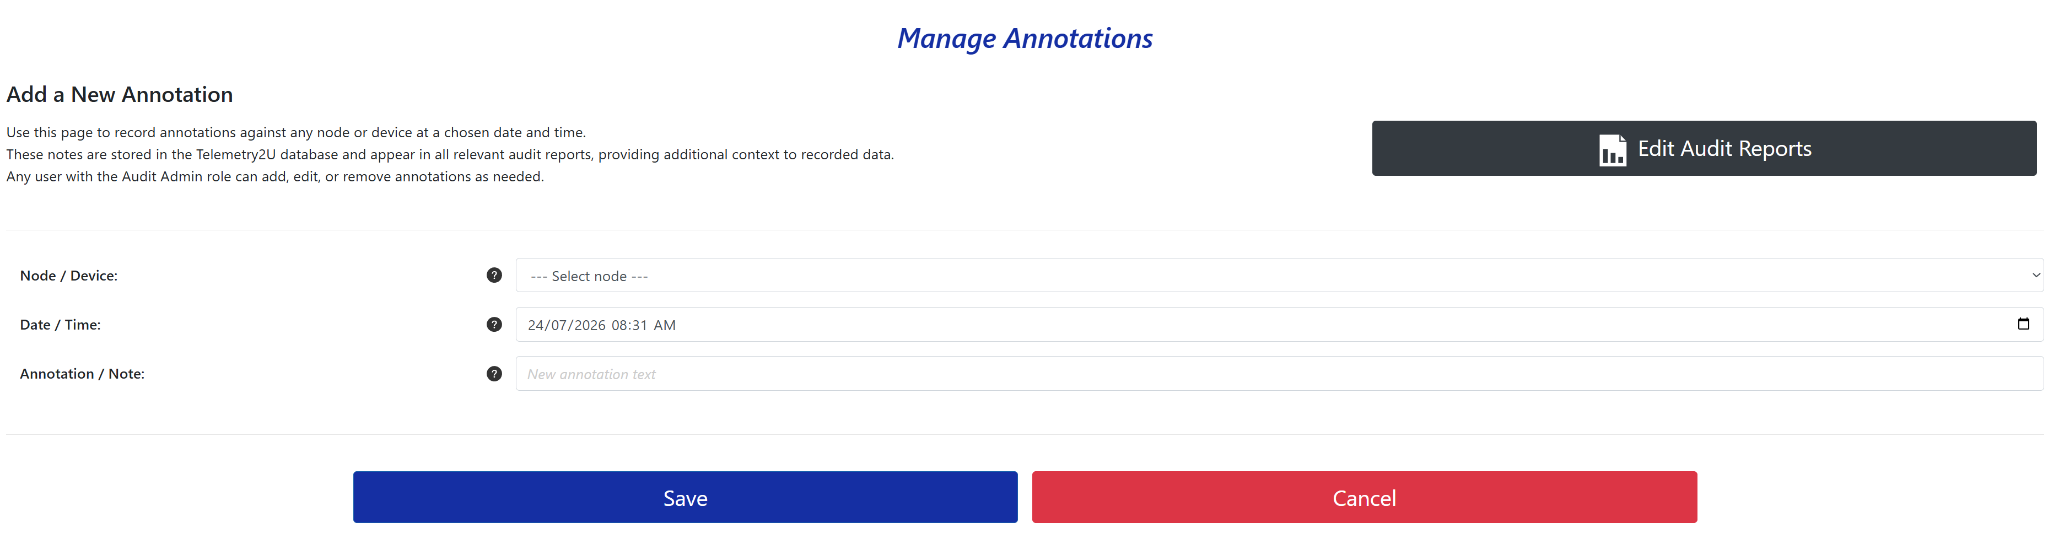
The Manage Annotations page provides a central location for recording, reviewing, editing, deleting, and exporting dated notes for nodes and devices in Telemetry2U.
Open Audit Reports from the platform sidebar, then select Manage Annotations. The page includes a form for creating new annotations and a complete table of annotations previously recorded for the account.
Add a New Annotation
Use the new-annotation form to record a note against any available node or device at a selected date and time.
- Select the required device from the Node / Device list.
- Enter the relevant Date / Time. Use the date-and-time picker at the end of the field to select the value when required.
- Enter the required explanation in Annotation / Note.
- Select Save to store the annotation.
Saved annotations remain available in the account history and can appear in audit reports configured to include annotations.
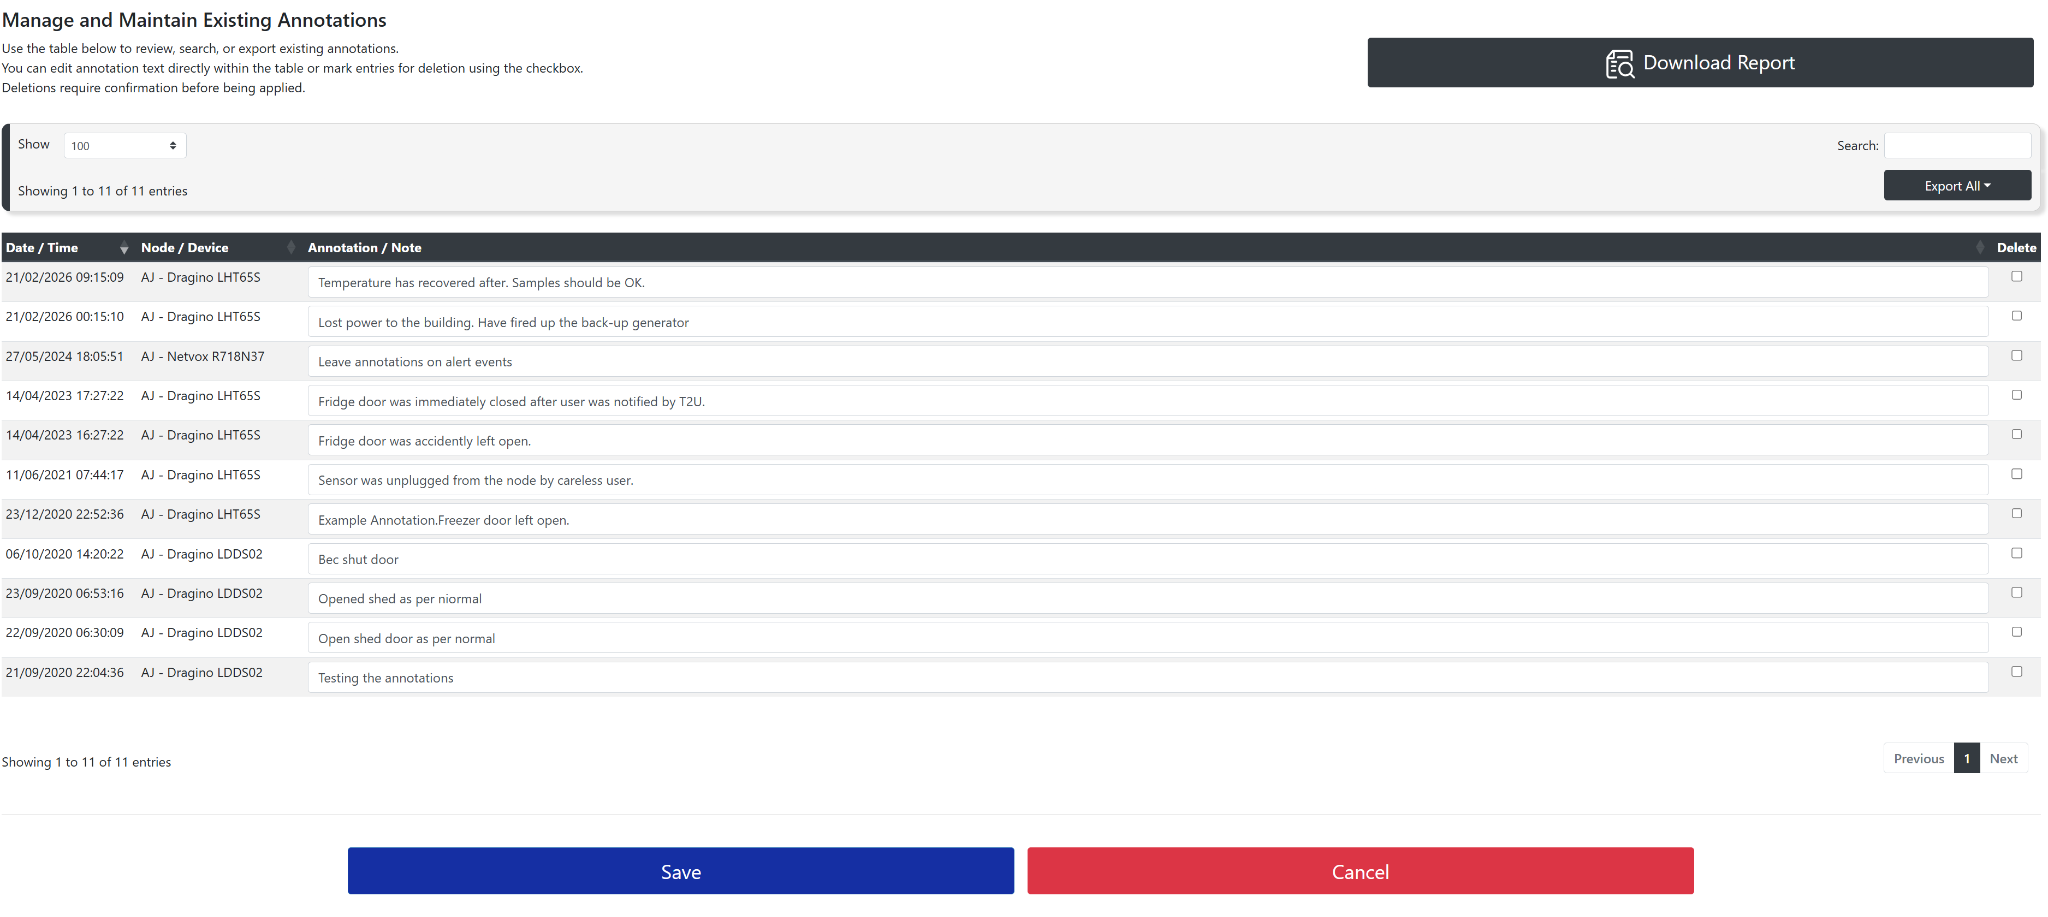
Manage and Maintain Existing Annotations
The annotations table contains the complete annotation history available to the account. Use the table controls to locate, revise, remove, or export existing entries.
- Search: enter text in the Search field to filter the displayed annotations.
- Sort: select the arrows in a column heading to reorder the table by date and time, node or device, or another sortable column.
- Edit: change the text directly in the Annotation / Note field, then select Save.
- Delete: select the checkbox in the Delete column, select Save, and confirm the deletion when prompted.
- Export: use Download Report or Export All to download the annotation history in an available Excel, CSV, or PDF format.
5.6 - Failure Analysis
The Failure Analysis page reviews alert events and provides an assessment of the most likely cause, helping users investigate temperature excursions and other abnormal readings recorded in Telemetry2U.
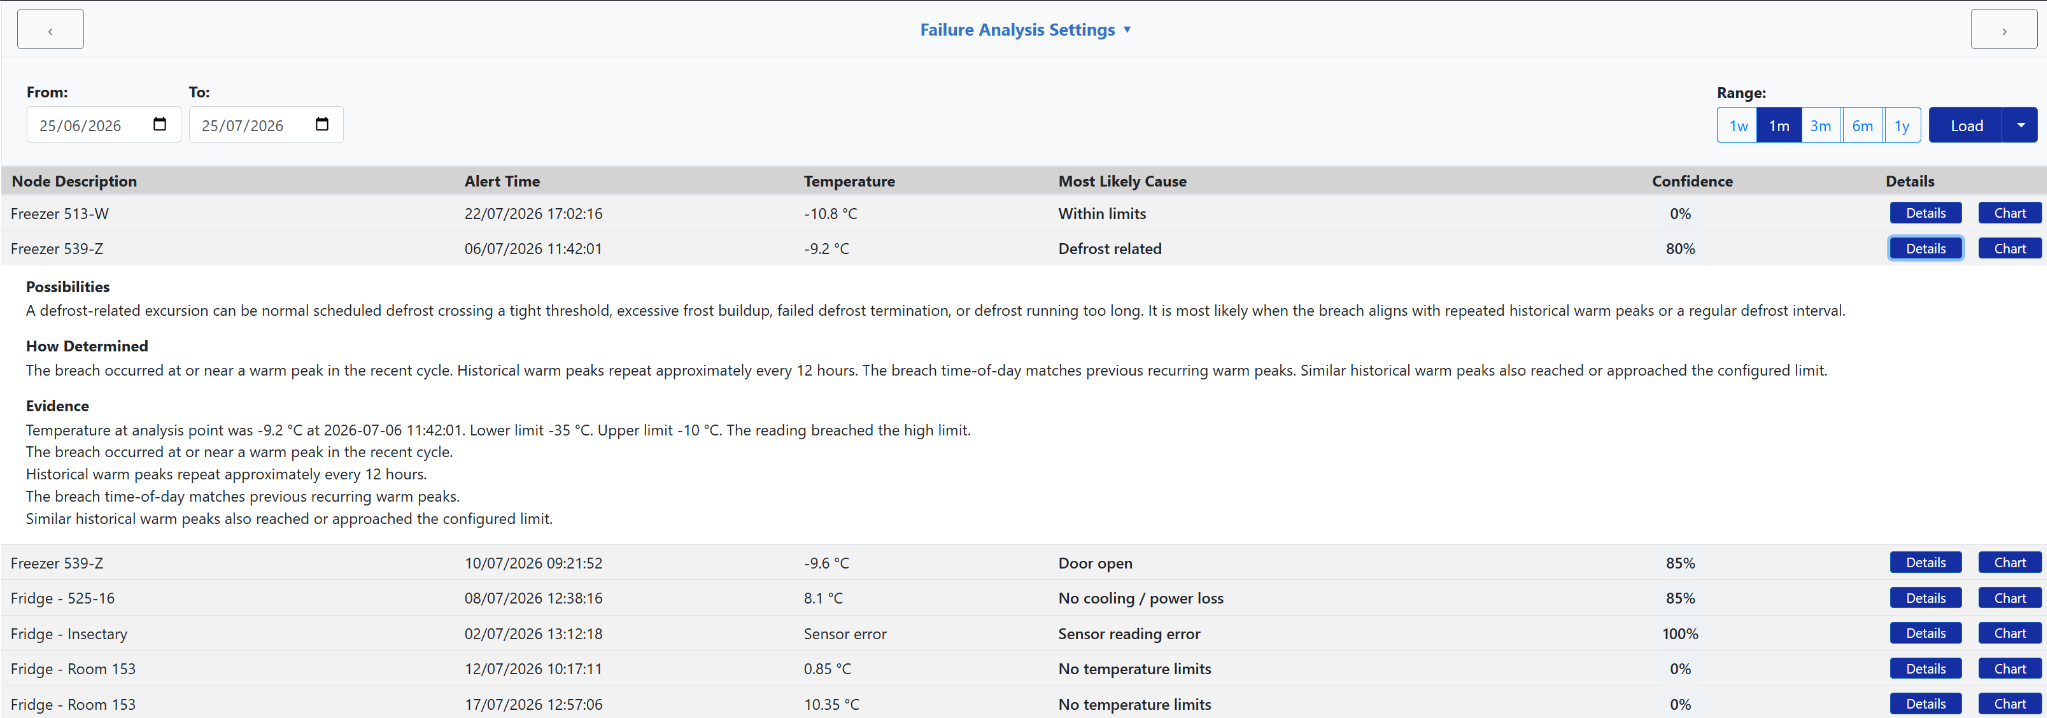
Each result includes the affected node, alert time, recorded temperature, most likely cause, and a confidence value. Supporting evidence and the corresponding chart period can then be opened for a more detailed review.
Select the Analysis Period
- Enter the required dates in the From and To fields.
- Alternatively, use the range buttons to select 1 week, 1 month, 3 months, 6 months, or 1 year.
- Select Load to display the alert events found within the selected period.
- Use the arrow beside Load to export the displayed failure analysis in CSV or Excel format.
Review the Analysis Results
Each row represents an alert event and displays:
- Node Description: the node or monitored asset associated with the alert.
- Alert Time: when the alert event occurred.
- Temperature: the recorded value at the analysis point, or a sensor reading error where applicable.
- Most Likely Cause: the condition identified by the analysis.
- Confidence: the confidence level assigned to the suggested cause.
Investigate an Alert Event
View Supporting Details
Select Details to expand the result. The expanded information describes the possible cause, how the conclusion was determined, and the evidence identified from the alert and historical readings.
The details may include the temperature recorded at the analysis point, configured limits, recurring historical patterns, and other observations used to calculate the suggested cause and confidence level.
Open the Chart
Select Chart to open the relevant date or period on the Charts page. This allows the alert event, surrounding readings, configured limits, and historical pattern to be reviewed visually.
Use the chart to compare the alert with earlier readings and determine whether the event is isolated or part of a recurring pattern.
5.7 - Document Verification
Document verification allows a generated PDF, CSV, or Excel file to be checked against the original file created by Telemetry2U.
When Include Document Verification is enabled in the Audit Report configuration, each generated file is assigned a unique Document ID. Telemetry2U also calculates and stores the file's original SHA-512 hash.
A SHA-512 hash acts as a cryptographic fingerprint of the file. When the file is checked later, Telemetry2U calculates its SHA-512 hash again and compares it with the value stored when the document was originally generated. A matching hash confirms that the uploaded file is identical to the original generated document.
For a complete worked example, including Excel exports, document verification, Excel protection, and optional multi-sensor analysis, see the Export, Verify and Consolidate Multi-Sensor Audit Data in Excel technical bulletin .
Generate a Verifiable File
Enable Include Document Verification when configuring the Audit Report. Generated PDF, CSV, and Excel files are then assigned their own Document ID and verification record.
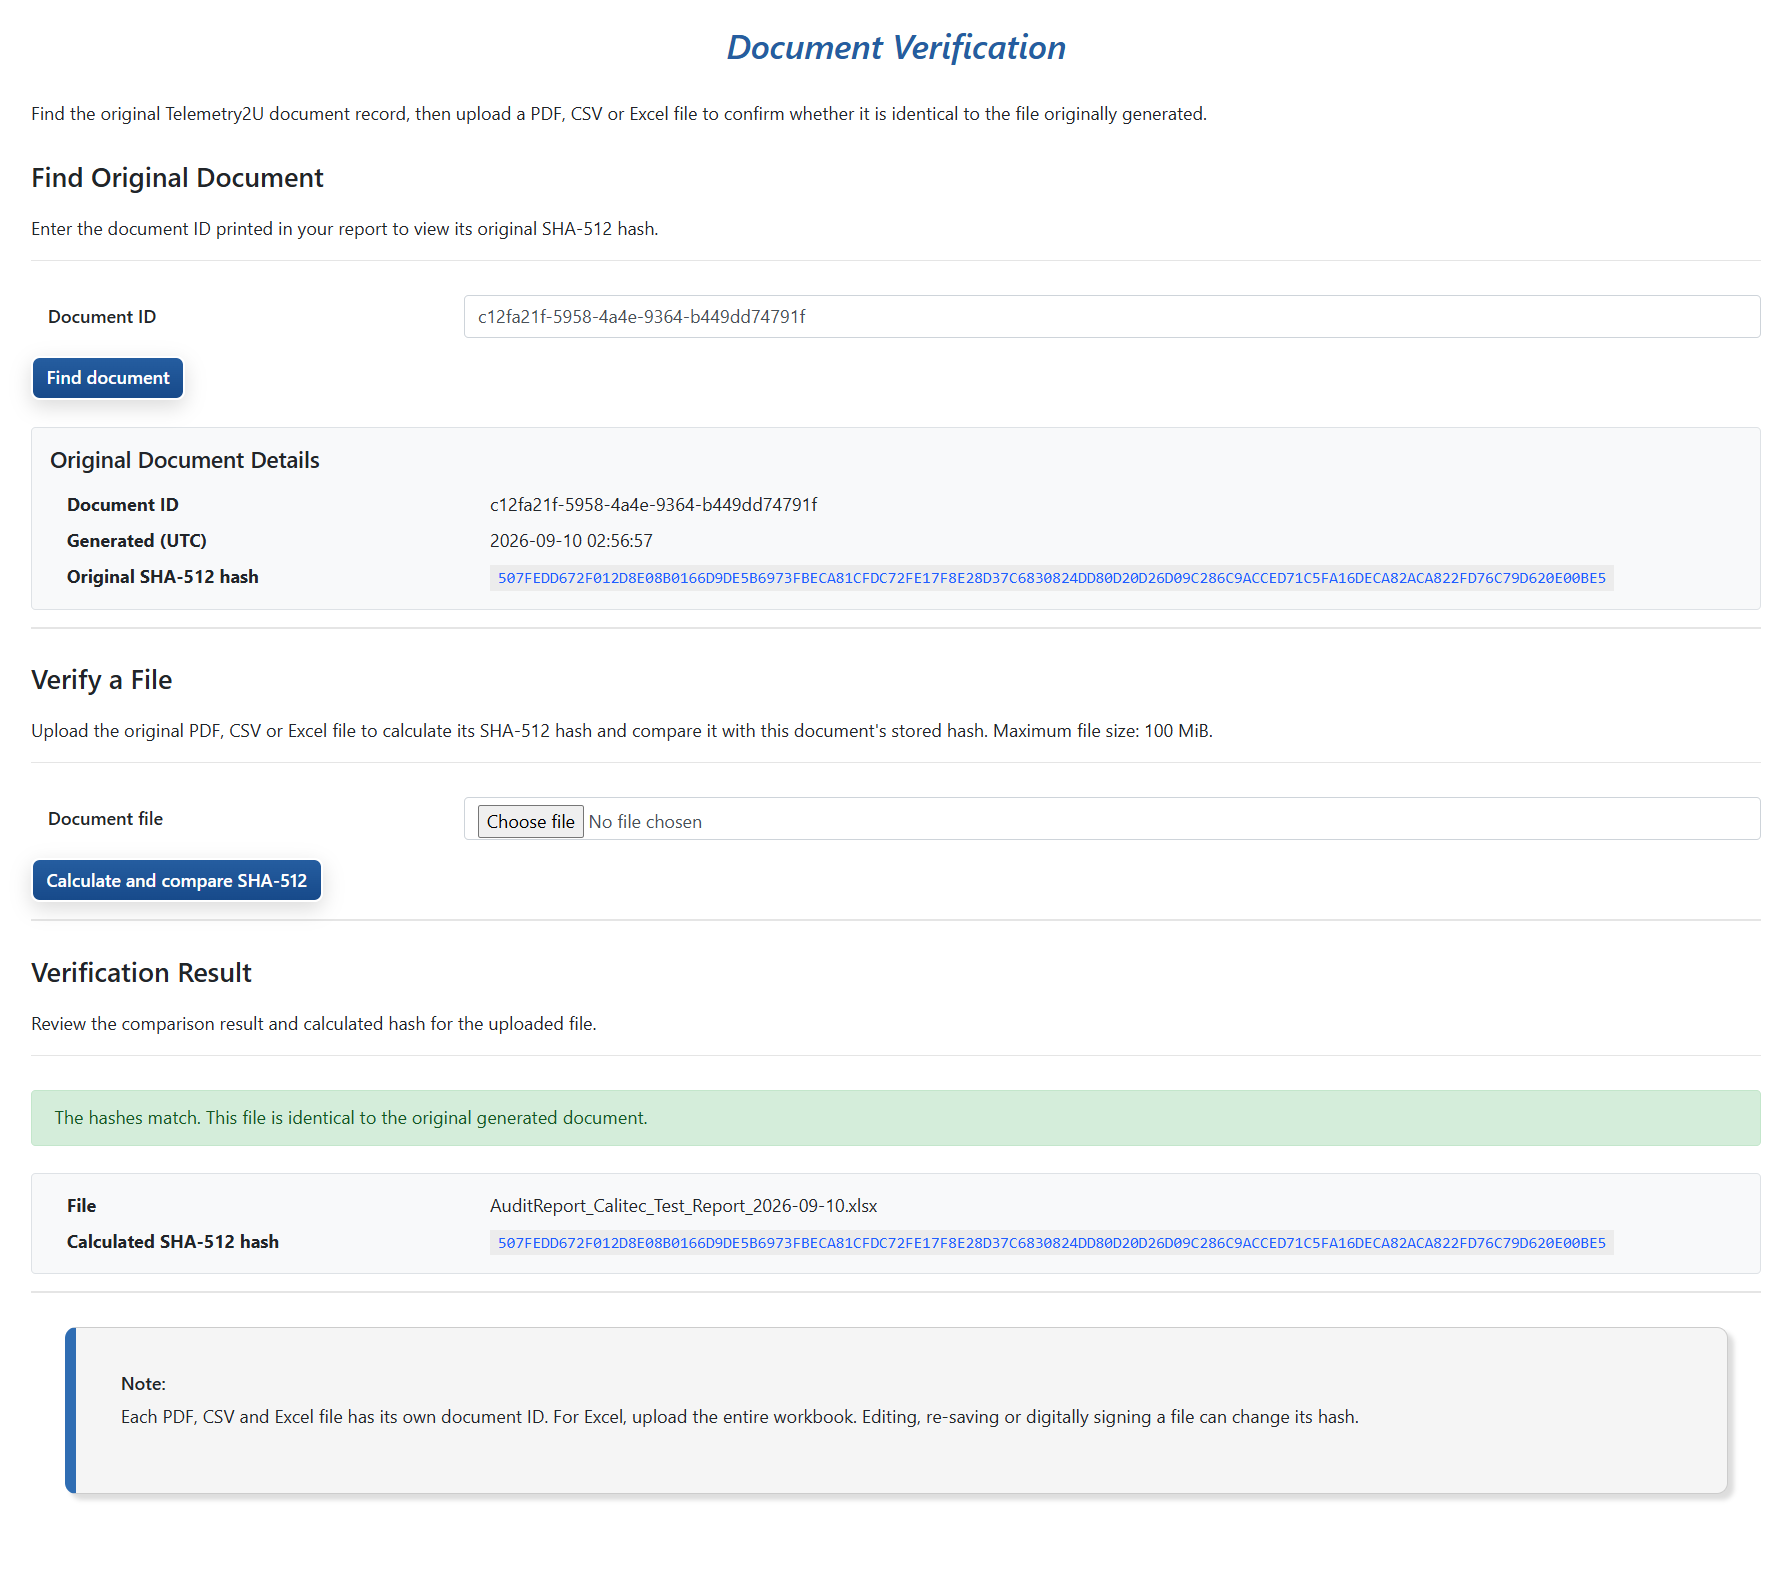
Find the Original Record
Open the verification link contained in the generated file. The Document Verification page opens with the Document ID populated automatically. The ID can also be entered manually.
Upload and Compare
Upload the PDF, CSV, or Excel file and select Calculate and compare SHA-512. The calculated hash is compared with the original stored hash and the verification result is displayed.
Verify the Original File
The verification record displays the Document ID, the time the document was generated in UTC, and the original SHA-512 hash.
- Follow the verification link contained in the generated document, or open the Document Verification page and enter the Document ID manually.
- Select Find document to retrieve the original verification record.
- Under Verify a File, select the original PDF, CSV, or Excel file.
- Select Calculate and compare SHA-512.
- Review the Verification Result and calculated SHA-512 hash.
When the hashes match, the uploaded file is byte-for-byte identical to the document originally generated by Telemetry2U.
What Can Change the Hash?
The hash is calculated from the exact contents of the file. Editing, re-saving, digitally signing, or otherwise modifying a document can produce a different SHA-512 hash.
Keep the original generated file unchanged when it may need to be verified later. If the data needs to be edited or analysed, work from a copy and retain the original separately.
Excel Workbooks
Each generated Excel file has its own Document ID and verification record. When verifying an Excel export, upload the entire workbook, not an individual worksheet.
Adding, deleting, or changing worksheets alters the workbook and can therefore change its SHA-512 hash.